sebastiandaschner blog
Simple Binary Logging in Javavisibility_off
friday, february 03, 2023In a previous blog post, I’ll made The Case Against Logging, as to why most enterprise applications should rather avoid logging. This especially regards logging what is happening in or to the application, what would be better served with some journaling solution. In this blog post, I want to show some examples for simple binary logging to optimize the application’s performance.
Text-Based Vs. Binary
I previously pointed out that applications should use text-based logging (be it via log files or stdout) only in exceptional and rare cases, such as unrecoverable errors. If you don’t quite agree, you can have a look at the list of shortcomings of traditional logging.
In almost all cases, it technically makes more sense to log in an optimized, binary format, with exactly the amount of data needed, and analyze the logs using tooling when you have to. Initially, a binary log is more effort to setup than just appending strings to a log simply “because you can”, but it ultimately is better to work with, improves the performance and resource footprint, separates concerns, and allows for use case or module specific features.
Think of it as the difference in programmatically reading data from a website using a screen scraper or HTML parser compared to a nicely structured API served via HTTP.
Examples
Building up binary logging doesn’t have to involve external dependencies or tooling, although that can help. In a few examples, I’m showing the following solutions. Most of them can be setup with one, two classes per project:
The example project is generally the same as described in Logging Performance Comparison, and is available on GitHub.
Log Format
The interesting part of binary logging is the structure of the data, how it will be persisted on disk. As opposed to text-based logs where developers usually make use of a lot of freedom to append strings in almost which ever way they want, binary log formats greatly optimize and minimize the amount of data required. They usually make use of every single bit, involving bit masks and custom structures.
Once you do the exercise to take inventory over all the kinds of journaling events in your application, you quite quickly can come up with a binary structure that minimizes the amount of data required. For example, the type of event can be serialized as single byte or short, instead of a much larger, variable-sized string that holds the name.
In our example, we use the following, admittedly quite simplified and minimalistic structure:
 0                   1
 0 1 2 3 4 5 6 7 8 9 0 1 2 3 4   bytes
+-+-+-+-+-+-+-+-+-+-+-+-+-+-+-+
|   timestamp   | t |  data   |
+-----------------------------+
|   timestamp   | t |  data   |
+-----------------------------+
|                           ...
Every event will be serialized in 14 bytes; why 14? We need 8 bytes for the timestamp, represented as long, a short (2 bytes) for the type of event (t), and another 4 bytes for event-specific data, such as an int or other data serialized in 4 bytes.
To use the same example of the method invocation count we have seen in our Logging Performance Comparison, we can invoke our binary logger similarly as follows:
@Inject
Logger logger; // custom type

// ...

logger.log(Logger.Context.HELLO_METHOD, count);
The Logger.Context (or maybe you want to call it LogType or EventType), is an enum for which the ordinal value will be serialized, and in our case the int count will be used as data.
This method signature should be as use-case specific as possible, so you want to offer one or multiple signatures that exactly capture what you need to persist.
Thus, another naming example would be:
logger.log(EventType.USER_LOGGED_IN, user.getId());... and so on.
The following shows some example writers how to serialize this.
Simple Binary Writer
The first, rather basic solution will append binary data to a file, in a synchronous, direct way.
@ApplicationScoped
public class Logger {

    private FileChannel channel;
    private ByteBuffer bb;
    private Path path;

    @PostConstruct
    void init() throws IOException {
        path = Files.createTempFile("quarkus-binary-writer-", ".log");
        channel = FileChannel.open(path, StandardOpenOption.APPEND);
        bb = ByteBuffer.allocate(14);
    }

    @Lock
    public void log(Context context, int count) {
        try {
            bb.clear();
            bb.putLong(System.currentTimeMillis());
            bb.putShort((short) context.ordinal());
            bb.putInt(count);
            bb.flip();
            channel.write(bb);
        } catch (IOException e) {
            throw new UncheckedIOException(e);
        }
    }

    @PreDestroy
    void close() throws IOException {
        channel.close();
    }

    // ...
}
The Logger class will append to a temporary file using a ByteBuffer of 14 bytes.
It directly appends the bytes in the format described before and needs to synchronize invocations (using Quarkus' @Lock annotation).
The reason we choose a file in the temp directory is that it will be backed by memory (tmpfs) and thus compares to our text-based logger examples in the previous post.
Examining the Log File
Now, when you run the example that you can find on GitHub, you can examine the created file:
$> curl localhost:8080/hello
$> curl localhost:8080/hello
$> curl localhost:8080/hello

$> ls /tmp/quarkus-binary-writer*
/tmp/quarkus-binary-writer-17198034805962729765.log

$> hexdump /tmp/quarkus-binary-writer-17198034805962729765.log | head
0000000 0000 8601 fb15 1f2e 0200 0000 0000 0000
0000010 8601 fb15 1f2e 0200 0000 0100 0000 8601
0000020 fb15 1f2e 0200 0000 0200 0000 8601 fb15
0000030 1f2e 0200 0000 0300 0000 8601 fb15 1f2e
0000040 0200 0000 0400 0000 8601 fb15 1f2e 0200
0000050 0000 0500 0000 8601 fb15 202e 0200 0000
0000060 0600 0000 8601 fb15 202e 0200 0000 0700
0000070 0000 8601 fb15 202e 0200 0000 0800 0000
0000080 8601 fb15 202e 0200 0000 0900 0000 8601
0000090 fb15 202e 0200 0000 0a00 0000 8601 fb15
If you’re used to text-based logs, this at first looks like a discouraging mess, but it’s actually not that bad. If you look at the dump for a few seconds, you likely start to see some structure already. Let’s go over the bytes one by one.
The first 8 bytes represent the timestamp as milliseconds and will likely be identical or very similar in this short invocation window.
0 1  2 3  4 5  6 7  byte index
0000 8601 fb15 1f2e
The next field, or event type (short, 2 bytes) always show the value 2, the ordinal of our enum:
8 9  byte index
0200
And the integer represents our invocation count:
1
0 1  2 3  byte index
0000 0000
...
0000 0100
...
0000 0200
To examine this by hand is helpful to verify that the file was written correctly, but of course you would use some sort of tooling to extract the information:
public String dump() {
    StringBuilder builder = new StringBuilder();

    try {
        byte[] bytes = Files.readAllBytes(path);
        ByteBuffer buffer = ByteBuffer.wrap(bytes);

        while (buffer.hasRemaining()) {
            builder
                    .append(buffer.getLong())
                    .append(':')
                    .append(Context.values()[buffer.getShort()].name())
                    .append(':')
                    .append(buffer.getInt())
                    .append('\n');
        }

        return builder.toString();
    } catch (IOException e) {
        throw new UncheckedIOException(e);
    }
}
1675406028319:HELLO_METHOD:0 1675406028319:HELLO_METHOD:1 1675406028319:HELLO_METHOD:2 1675406028319:HELLO_METHOD:3 1675406028319:HELLO_METHOD:4 1675406028319:HELLO_METHOD:5 1675406028320:HELLO_METHOD:6 1675406028320:HELLO_METHOD:7 1675406028320:HELLO_METHOD:8 1675406028320:HELLO_METHOD:9 ...
Now, we also have the chance to directly extract the desired information, without the use of log analysis tools, regular expressions, and the like. For example we’d like to see all events that happened within a time span or that are of a specific type. This is the reasoning behind logging in text-based but machine-readable formats such as JSON, but now in a way that involves less resource overhead.
public String dump() {
    StringBuilder builder = new StringBuilder();

    try {
        byte[] bytes = Files.readAllBytes(path);
        ByteBuffer buffer = ByteBuffer.wrap(bytes);

        while (buffer.hasRemaining()) {
            LogEntry entry = new LogEntry(buffer.getLong(), buffer.getShort(),
                    buffer.getInt());

            // querying as required, here on context and every 100th entry
            if (entry.context == Context.HELLO_METHOD && entry.data % 100 == 0) {
                builder.append(entry).append('\n');
            }

        }

        return builder.toString();
    } catch (IOException e) {
        throw new UncheckedIOException(e);
    }
}

public record LogEntry(Instant instant, Context context, int data) {

    public LogEntry(long timestamp, short contextOrdinal, int data) {
        this(Instant.ofEpochMilli(timestamp), Context.values()[contextOrdinal], data);
    }

}
LogEntry[instant=2023-02-03T07:06:59.378Z, context=HELLO_METHOD, data=0] LogEntry[instant=2023-02-03T07:06:59.379Z, context=HELLO_METHOD, data=100] LogEntry[instant=2023-02-03T07:06:59.379Z, context=HELLO_METHOD, data=200] LogEntry[instant=2023-02-03T07:06:59.380Z, context=HELLO_METHOD, data=300] LogEntry[instant=2023-02-03T07:06:59.380Z, context=HELLO_METHOD, data=400] LogEntry[instant=2023-02-03T07:06:59.380Z, context=HELLO_METHOD, data=500] LogEntry[instant=2023-02-03T07:06:59.381Z, context=HELLO_METHOD, data=600] LogEntry[instant=2023-02-03T07:06:59.381Z, context=HELLO_METHOD, data=700] LogEntry[instant=2023-02-03T07:06:59.381Z, context=HELLO_METHOD, data=800] LogEntry[instant=2023-02-03T07:06:59.382Z, context=HELLO_METHOD, data=900]
Building up a representation of your journaling data represents a higher initial effort but definitely pays off in the long run.
Binary Buffered Writer
Writing every single log invocation of course has a big negative impact on our throughput as the locking and context switching costs for I/O are quite significant. In this example, we use a buffered approach:
@ApplicationScoped
public class Logger {

    private FileChannel channel;
    private ByteBuffer bb;
    private Path path;

    @PostConstruct
    void init() throws IOException {
        path = Files.createTempFile("quarkus-binary-writer-buffer-log-", ".log");
        channel = FileChannel.open(path, StandardOpenOption.APPEND);
        bb = ByteBuffer.allocate(14 * 4096);
        bb.clear();
    }

    @Lock
    public void log(Context context, int count) {
        try {
            bb.putLong(System.currentTimeMillis());
            bb.putShort((short) context.ordinal());
            bb.putInt(count);

            if (!bb.hasRemaining()) {
                bb.flip();
                channel.write(bb);
                bb.clear();
            }
        } catch (IOException e) {
            throw new UncheckedIOException(e);
        }
    }

    @PreDestroy
    void close() throws IOException {
        channel.close();
    }
}
We choose a byte buffer that can hold 4096 of our entries. Since we made sure the number of bytes of each entry align with the buffer size, that is the buffer will be filled up exactly 100%, we don’t need to flush the buffer early nor use padding.
When trying out this example, this works in the same way, with the exception that most events don’t show up immediately, only after every 4096th invocation. If this is fine for your system, this approach is already a reasonable improvement.
This solution already greatly increases the performance, almost 7 times faster than the simple binary writer, and about 3 times faster than it’s text-based counterpart (measured on my machine, see conclusion below).
Disruptor Buffered Writer
For those of you who have heard of lock-free data structures, you will probably already wonder why we still lock every method invocation. While this is required for a simpler buffer approach, we can of course swap this byte buffer to a more sophisticated ring buffer approach. Here, we’ll use the LMAX Disruptor that allows to handle events without locking:
@ApplicationScoped
public class Logger {

    private Disruptor<Event> disruptor;
    private RingBuffer<Event> ringBuffer;

    @Inject
    ManagedExecutor managedExecutor;

    @Inject
    JournalConsumer journalConsumer;

    @PostConstruct
    void init() {
        int bufferSize = 8192;

        disruptor = new Disruptor<>(Event::new, bufferSize, managedExecutor);
        disruptor.handleEventsWith(journalConsumer);
        disruptor.start();

        ringBuffer = disruptor.getRingBuffer();
    }

    public void log(Context context, int count) {
        long sequence = ringBuffer.next();

        Event event = ringBuffer.get(sequence);
        event.context = context;
        event.count = count;

        ringBuffer.publish(sequence);
    }

    @PreDestroy
    void close() {
        disruptor.shutdown();
    }

    public static class Event {

        public Context context;
        public int count;

    }

    public enum Context {
        MAIN, TEST, HELLO_METHOD, GOODBYE_METHOD
    }
}
The disruptor will handle events with our custom JournalConsumer:
@ApplicationScoped
public class JournalConsumer implements EventHandler<Logger.Event> {

    private FileChannel channel;
    private ByteBuffer bb;

    @PostConstruct
    void init() throws IOException {
        channel = FileChannel.open(Files.createTempFile("quarkus-disruptor-buffer-log-",
                ".log"), StandardOpenOption.APPEND);
        bb = ByteBuffer.allocate(14 * 4096);
    }

    @Override
    public void onEvent(Logger.Event event, long sequence, boolean endOfBatch)
            throws IOException {
        bb.putLong(System.currentTimeMillis());
        bb.putShort((short) event.context.ordinal());
        bb.putInt(event.count);

        if (!bb.hasRemaining()) {
            bb.flip();
            channel.write(bb);
            bb.clear();
        }
    }

    @PreDestroy
    void close() throws IOException {
        channel.close();
    }
}
In order to also not write to disk on every single event, we use a similar buffer approach as before. This consumer involves no locking and the whole solution improves the throughput.
For a detailed explanation of how the disruptor works, have a look at its documentation.
Chronicle Queue Binary Writer
The last example we want to have a look at is a journaling example using Chronicle Queue a low-latency messaging library that allows to persist binary data.
Our logger uses a Chronicle Queue to append so-called documents, that we can define in their structure. This approach is more flexible out of the box, since we the individual documents include headers that allow to adapt the structure to different types of events, and have ways to add variable-sized strings.
@ApplicationScoped
public class Logger {

    private ChronicleQueue queue;

    @PostConstruct
    void init() throws IOException {
        File basePath = Files.createTempDirectory("chronicle-queue").toFile();
        System.out.println("creating queue at " + basePath);
        queue = SingleChronicleQueueBuilder.binary(basePath).build();
    }

    public Appender appender() {
        return new Appender(queue.acquireAppender());
    }

    @PreDestroy
    void close() {
        queue.close();
    }

    public static class Appender implements Closeable {

        private final DocumentContext documentContext;

        private Appender(ExcerptAppender appender) {
            documentContext = appender.writingDocument();
        }

        public void log(Context context, int count) {
            documentContext.wire().bytes()
                    .writeLong(System.currentTimeMillis())
                    .writeUnsignedShort(context.ordinal())
                    .writeInt(count);
        }

        @Override
        public void close() {
            documentContext.close();
        }
    }

    public enum Context {
        MAIN, TEST, HELLO_METHOD, GOODBYE_METHOD
    }

}
A Chronicle Queue allows to acquire a appender that can be used without locking in the current thread. Our example wraps the Chonicle Queue appender into a custom one, which allows to append in our log method multiple times which improves the performance compared to acquiring an appender for every single use:
int counter = 0;
try (Logger.Appender appender = logger.appender()) {
    for (; counter < 1_000; counter++) {
        appender.log(Logger.Context.HELLO_METHOD, counter);
    }
}
If the structure of our log events requires a certain flexibility, this approach makes sense. Of course, we can read the contents of our queue via code:
public String dump() {
    StringBuilder builder = new StringBuilder();
    ExcerptTailer tailer = queue.createTailer();
    while (true) {
        try (DocumentContext dc = tailer.readingDocument()) {
            if (!dc.isPresent())
                break;
            final Bytes<?> bytes = dc.wire().bytes();
            while (bytes.readRemaining() > 0) {
                builder
                        .append(bytes.readLong())
                        .append(':')
                        .append(Context.values()[bytes.readUnsignedShort()])
                        .append(':')
                        .append(bytes.readInt())
                        .append('\n');
            }
        }
    }
    return builder.toString();
}
As you likely can imagine, here we could equally well query certain events by their type, timestamp, and so on.
Chronicle Queue performs very well, which we will see in the conclusion, though you want to keep the contention of your appenders in mind. Admittedly, this is a constructed example that puts a great amount of contention on the journaling system, especially with regards to the thread pool sizes, etc.
Summary
While these examples are just that: simple examples for basic binary logging, I hope they transport the idea that binary logging is not as daunting as it might seem. First of all, binary logging doesn’t have to be complicated nor involve complex dependencies since it can be done in a few lines of code, while these few lines quickly outperform what’s out there in the market of text-based logging. Secondly, the actual logging can happen in a single point of responsibility, a class that is easily injected into our application code. These log methods should be tailored to our domain and requirements and thus communicate the intention much better. It’s also possible to come up with different log instances or logger types for different aspects of the application that then manage their own log formats and files.
In general, I want to point out how a custom binary logging solution quickly pays off in performance term yet doesn’t have to be that complicated to set up. Some basic tooling is created quickly and is often a more pragmatic choice than trying to configure third-party log formats or log aggregator tools.
Performance Comparison
Now to some numbers regarding the performance comparison, especially looking at what I compared in my post Logging Performance Comparison for text-based loggers.
These numbers have been measured on the same machine and setup like in the text-based approach, so they can give you a rough comparison. As for all benchmarks, the actual true numbers for you lay only in your production system.
In general, all binary writers outperform even the fastest measured text-based logger, with the exception for the simple binary writer. The reason for this is the contention caused by the lock and operating system I/O, since it involves a lot of overhead for every single invocation (which merely writes 14 bytes).
We can also see that the lock-free approaches by LMAX Disruptor and Chronicle Queue yield an additional improvement.
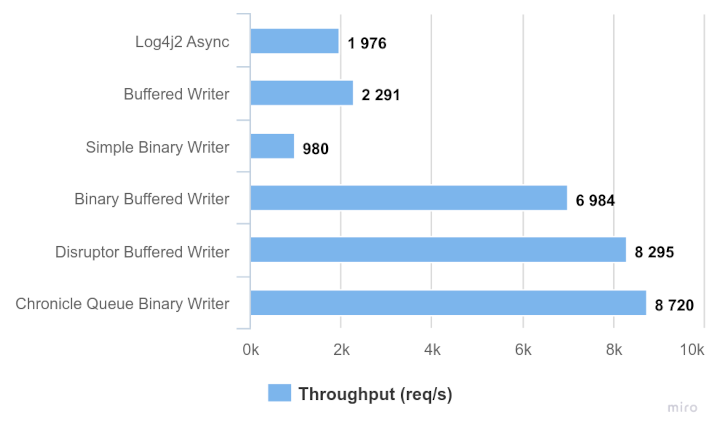
With regards to comparing the last two approaches I want to add that I’ve put in more optimization effort into the Chronicle Queue approach already, that is making sure the appenders get reused from within the invocation loop as well as the number of threads in Quarkus' thread pool. Without that, the increased contention makes the whole setup perform poorer. But it’s fair to say that this is a very constructed example, and while it aims to give an estimate on the impact of various logging approaches, it won’t be part of any production system. So I claim it’s fair to say that both the Disruptor and Chronicle Queue approach play within the same category.
Conclusion
Now what does that mean for our real-world applications? As I’ve pointed out before, it makes sense to reconsider the amount and types of data that we log to files and whether we’d be better served with a custom binary logging solution.
For a limited set of data and to get started, I’d encourage to start with a simple binary format using the Disruptor. There are some things you need to take care of yourself, such as log rotation as well as additional tooling. For more sophisticated and extensible approaches, the document-based way offered by Chronicle Queue including it’s tooling, support, and open source ecosystem makes sense and is worth looking into.
try to come up with minimal log data for a very limited set of data and high throughput, I’d encourage to start with a simple binary format using the disruptor for more sophisticated and extensible approaches, the document-based way in Chronicle Queue makes sense performance comparison, name some numbers
Found the post useful? Subscribe to my newsletter for more free content, tips and tricks on IT & Java: